Welcome to our Million Song Data Set project

Dive into the emergence of music genres throughout time and space

Introduction

For our final project in Dr. Robert West’s Applied Data Analysis class of Autumn 2017, we decided to focus on one of the freely-available largest collection of music data sets online: the Million Song Dataset. The core of this data set, is the feature analysis and metadata for one million songs, provided by The Echo Nest.

Since the emergence of compact disc, the music industry capabilities has expanded exponentially. Data could be stored efficiently and aggregated to this day. With the current computing capabilities, the field of big data analysis has emerged and allows us to explore and try to discover the secrets hidden behind what makes music such a magical and essential part throughout our lives.

This web page is separated into two parts and contains a majority of the relevant results we obtained through the analysis of this data set. If you are interested in more details, you can have a look at the github page of this project. The first section is about genre classification as well as chronological analysis and geographic representation of our data set. The second section consists in the building of an interactive 3D plot, where the user can walk through a data cloud and explore the different genre of music and listen to short previews for a better immersive experience.

Data

As this data set contains a million samples of song analysis, its entire size reaches 280GB. In order to ease our exploration through this data set, we decided to base our first analysis on only a subset of 10,000 songs (1%, 1.8 GB compressed). We then decided to download an other subset of the full Million Song Dataset (sample with hashed starting with letters “A” to “F”) for a total of approximately 133’000 songs.

For the first part of our project, (“genre propagation by year”) we filtered this subset on the existing gps location of the artist. The result is a set of 43383 samples.

For the second part (3d visualization), we filtered it differently using a threshold on the song_hotttnesss feature that gave us a result of 30’000 “most popular song”. Moreover, we extended our dataset with audio previews links from Deezer and Spotify API.

You will see below the first steps of our approach on these data set.

First look over the years

Let first have a look at the distribution of our data set over the year


From this distribution we can see that the data set contains much more sample starting from the 90's. This could be related to the emergence of the compact disc technology developed by Sony and Philips and launched in 1982 in which much more informations could be stored.

The music genre challenge

The first challenge on which we wanted to focus, was to know, if it was possible to group the sample under a music genre according to their metadata. To detect the genre of a song we based our analysis on the artist_terms attribute. Unfortunately this feature doesn't directly contain the genre of the artist (song), but rather terms that people have associated with this artist, most of the time this terms do correspond to genre but they might also be noise (such as a city). An other drawback of this feature, is that there is a lot of different sub-genre. To deal with that, we performed LDA (Latent Dirichlet Analysis) to find 10 "super-genre".


LDA (Latent Dirichlet Allocation):

In natural language processing, latent Dirichlet allocation (LDA) is a statistical model that allows sets of observations to be explained by unobserved groups that explain why some parts of the data are similar. For example, in our case, if observations are terms in the list of each sample’s artist_terms feature, it would describe the feature as a mixture of a small number of topics attributable to one general related topic. The topic here would be a genre and the aim is thus to group the tags into one bigger category representing a type of music.


Results of our topic modeling with the top eight tags by topic:


As well as their distribution in the data set:

Genre propagation by year

When visualizing the song through time on the map we realised that a song only stayed one epoch (frame) visible. For us it doesn't reflect the reality as once a song is released it will perdure for a certain amount of time. To simulate that we extend our data with duplicates of the song up to 10 years after its first apparition. We didn't want to naively duplicate the song as it would appear as a new song for 10 year long. Taking that into account, as time pass we decrease the song weight (its importance at representing the genre).

Genre analysis through space:

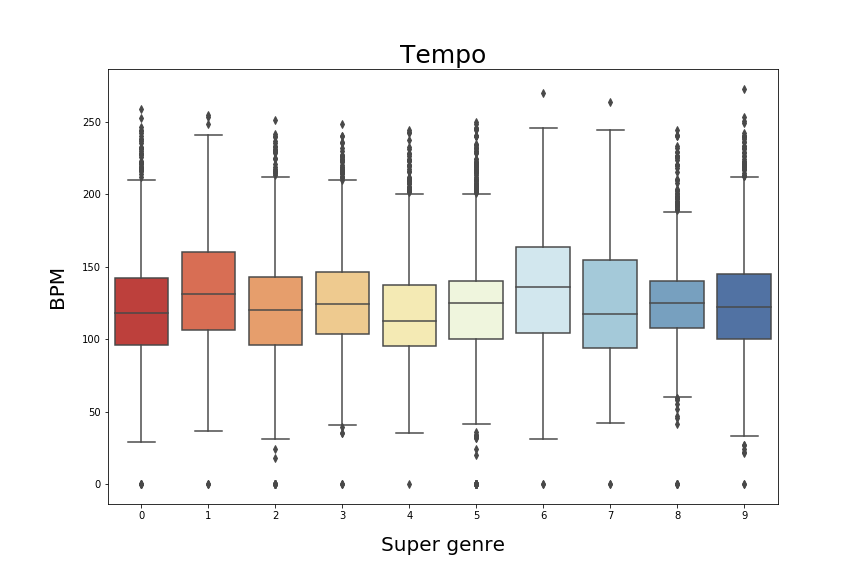
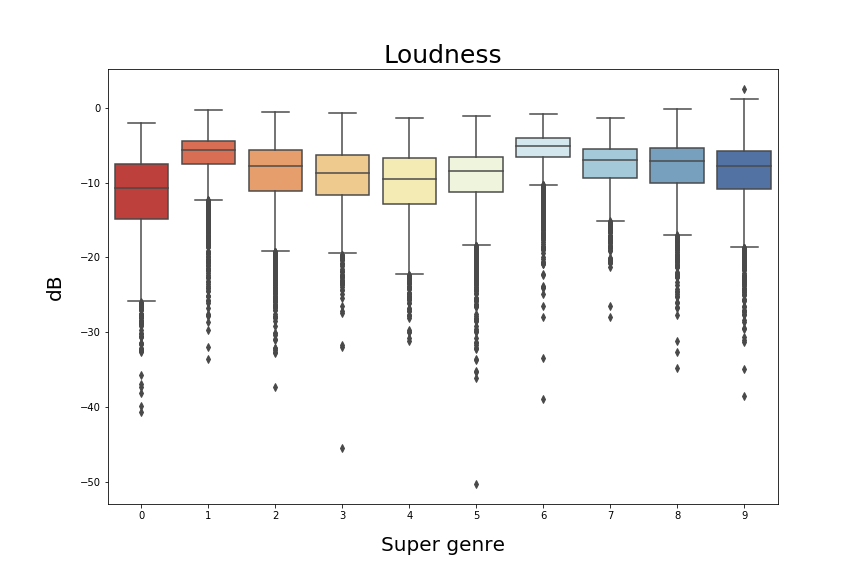
Now, lets try to put our genre classification into another perspective. More precisely, we want to confront the given labeling (tags) of the songs with some of their content informations. To do that, we focused on these given features : "tempo","loudness" with respect to the our genre labeling.

However, we can see below, that the box plots for the features : “loudness” and "tempo" are not really relevant with respect to the defined genres.

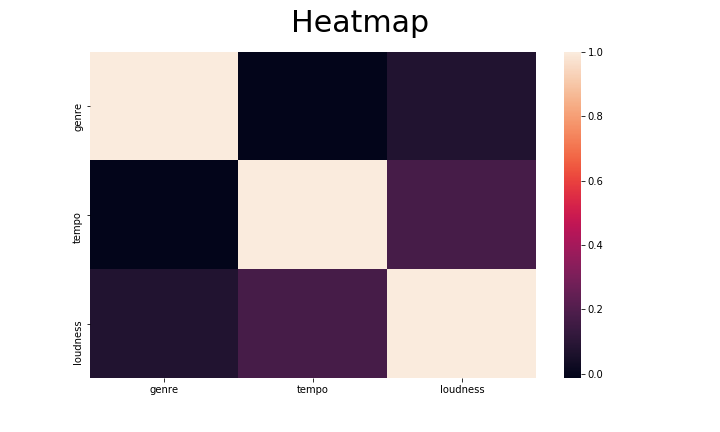
The correlations between them do not give better results neither:

We thus decided to have a closer look at the “segment_timbre” feature.

According to the Echonest documentation:

  • Segments: are a set of sound entities (typically under a second) each relatively uniform in timbre and harmony. Segments are characterized by their perceptual onsets and duration in seconds, loudness (dB), pitch and timbral content.
  • The segment_timbre is a 12-dimensional vector which captures the “tone colour" for each segment of a song. In order to facilitate our calculations we decided to take the mean of all segments to represent each song with one single vector of size 12.

In order to see if we could get information from it, we started by applying on the vectors of a given genre, a principal component analysis (PCA). PCA, is a statistical procedure that uses an orthogonal transformation to convert a set of observations of possibly correlated variables into a set of values of linearly uncorrelated variables called principal components. We can see below, that the representation in space of two sets of songs, (coming from two different genre with respect to their two principal components values give some relevant results. Indeed, we can see well defined separation between the two music genre.

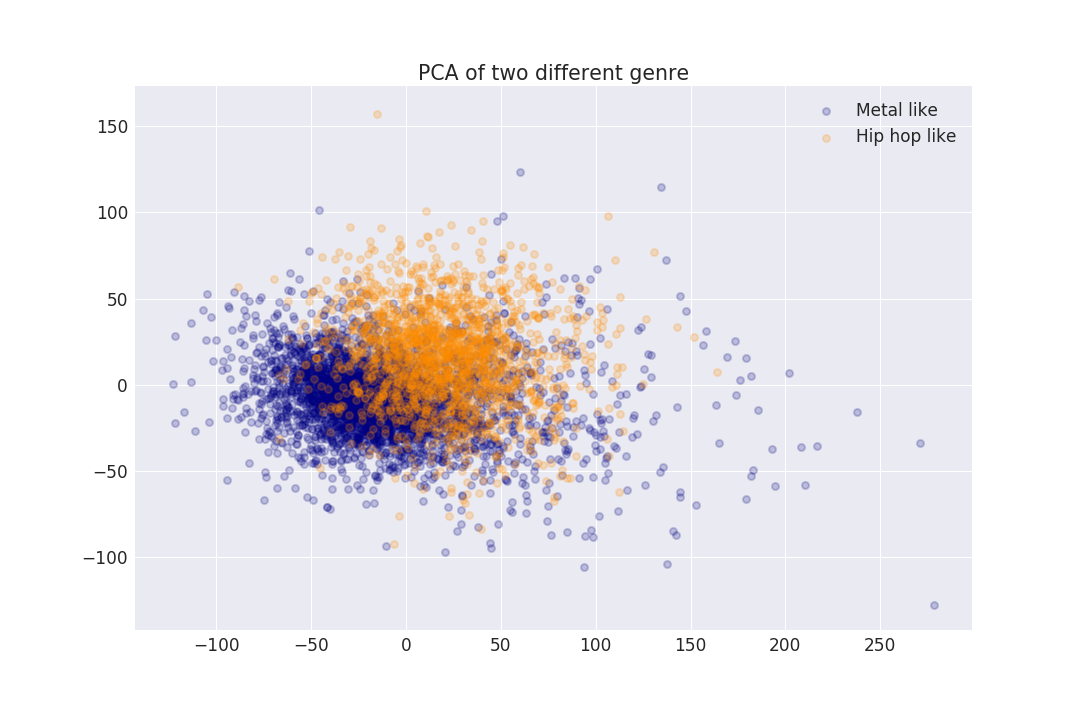
However, we can see that the points overlap. We thus decided to try a 3d approach.

Lets make it 3D !

Once trained using metadatas, we use our model to predict the genre distribution of each song based on their timbre informations. The training and prediction were performed using a simple neural network (you can have a look at our github notebook for detailed explanations). Based on this prediction we plot the songs in a 3 dimensional space using t-SNE, and for a better visualization purpose we colored each song by they super genre belonging.

The T-SNE approach, is is a machine learning algorithm for dimensionality reduction. It allows us to embed high-dimensional data into a two or three dimensional space, which can then be visualized in a scatter plot. While PCA is a linear algorithm, that will not be able to interpret complex polynomial relationship between features, t-SNE is based on probability distributions with random walk on neighborhood graphs to find the structure within the data. The probabilities representing the similarities, come from a conversion of the high-dimensional Euclidean distances between data. This allows the algorithm to build a 2 or 3 dimensional plot with pairs of points close to each other following this distribution.

Close points represent songs that are similar by their content, more specifically by their timbre feature. Therefore, it is often the case that they belong to the same super genre group, but it can happen that two different styles may be “spatially” close nonetheless. This is a nice way to compare metadata classification and content similarities while discovering artists that are of a unknown/other style which matches your personal tastes ! You can now explore it and verify by yourself the accuracy of our results !

(We advise you to use a mouse to enjoy the complete diving experience).
Clicking on a point give you access to a preview of the song ! ;)
Sorry no Preview found for this track
Stop music !

History :

Contact us

  • Charles Gallay
  • Thomas Batschelet
  • Boris Flückiger